TRACKING PRICE DYNAMICS DURING A PANDEMIC

In this project, the researchers:
- explore an easily-scalable, non-traditional way for collecting timely, high-frequency price data with wide geographic coverage,
- track and unpack price dynamics during the initial lockdown period and the subsequent re-opening phase, and
- study the link between changes in visiting patterns at workplaces, grocery stores and other retail locations and price dynamics.
The team relied on a quick-response online survey to generate real-time price data during the evolving pandemic for Kenya and Uganda. Researchers recruited volunteers, mainly university students and staff and network members of NGOs, and recorded prices for essential food items in an online form - either when or after visiting a shop in-person or getting deliveries. Relying on this crowdsourcing approach, the team collected over 39,000 retail price quotes across Kenya and Uganda between April 2020 and mid-March 2021. Throughout the data collection period, the researchers regularly published real-time price information on this dashboard https://www.kenyacovidtracker.org/prices.html.
The researchers used this data to study price dynamics during the initial lockdown period in the first half of 2020, and the subsequent re-opening phase in the second half of 2020 and early 2021. The pandemic fundamentally altered mobility and consumption patterns even above and beyond immediate government-imposed restrictions. The study therefore specifically looks at the links between price dynamics and mobility patterns. To measure changes in mobility researchers draw on publicly available data on changes in visiting patterns of smartphone users at locations like workplaces, grocery and other retail stores.
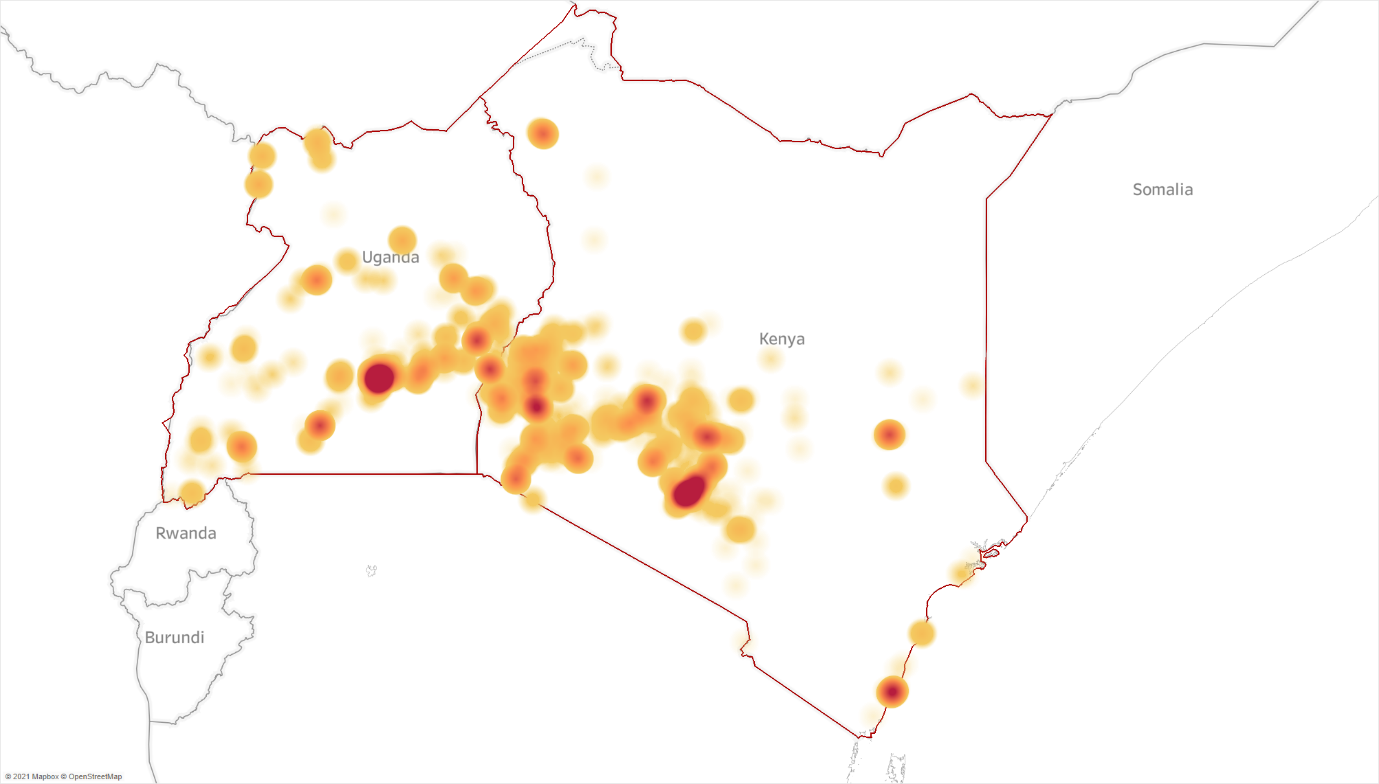
Geographic dispersion of the collected price quotes
Image description: The map plots the geographic dispersion of the collected price quotes for rice. Darker colours indicate a greater density of price quotes. Lighter colours indicate fewer price quotes.
The researchers find evidence that prices were higher during the initial weeks of lockdown in Kenya and Uganda. In Uganda, due to the longer and more stringent nature of the lockdown, the impact seems to have been more pronounced than in Kenya.
Kenya
After the end of the lockdown, prices remained lower for an extended period, than in the first weeks of the lockdown. While it cannot be ruled out that seasonality plays a partial role, this finding is likely driven by the sustained reduction in household incomes due to the pandemic and the associated economic shock (Pape et al., 2020 and Kansiime et al., 2021).
The price trend in Greater Nairobi and Mombasa, which had seen additional travel restrictions early on in the pandemic, does not follow a different trajectory than the rest of the country (see Figure 1).
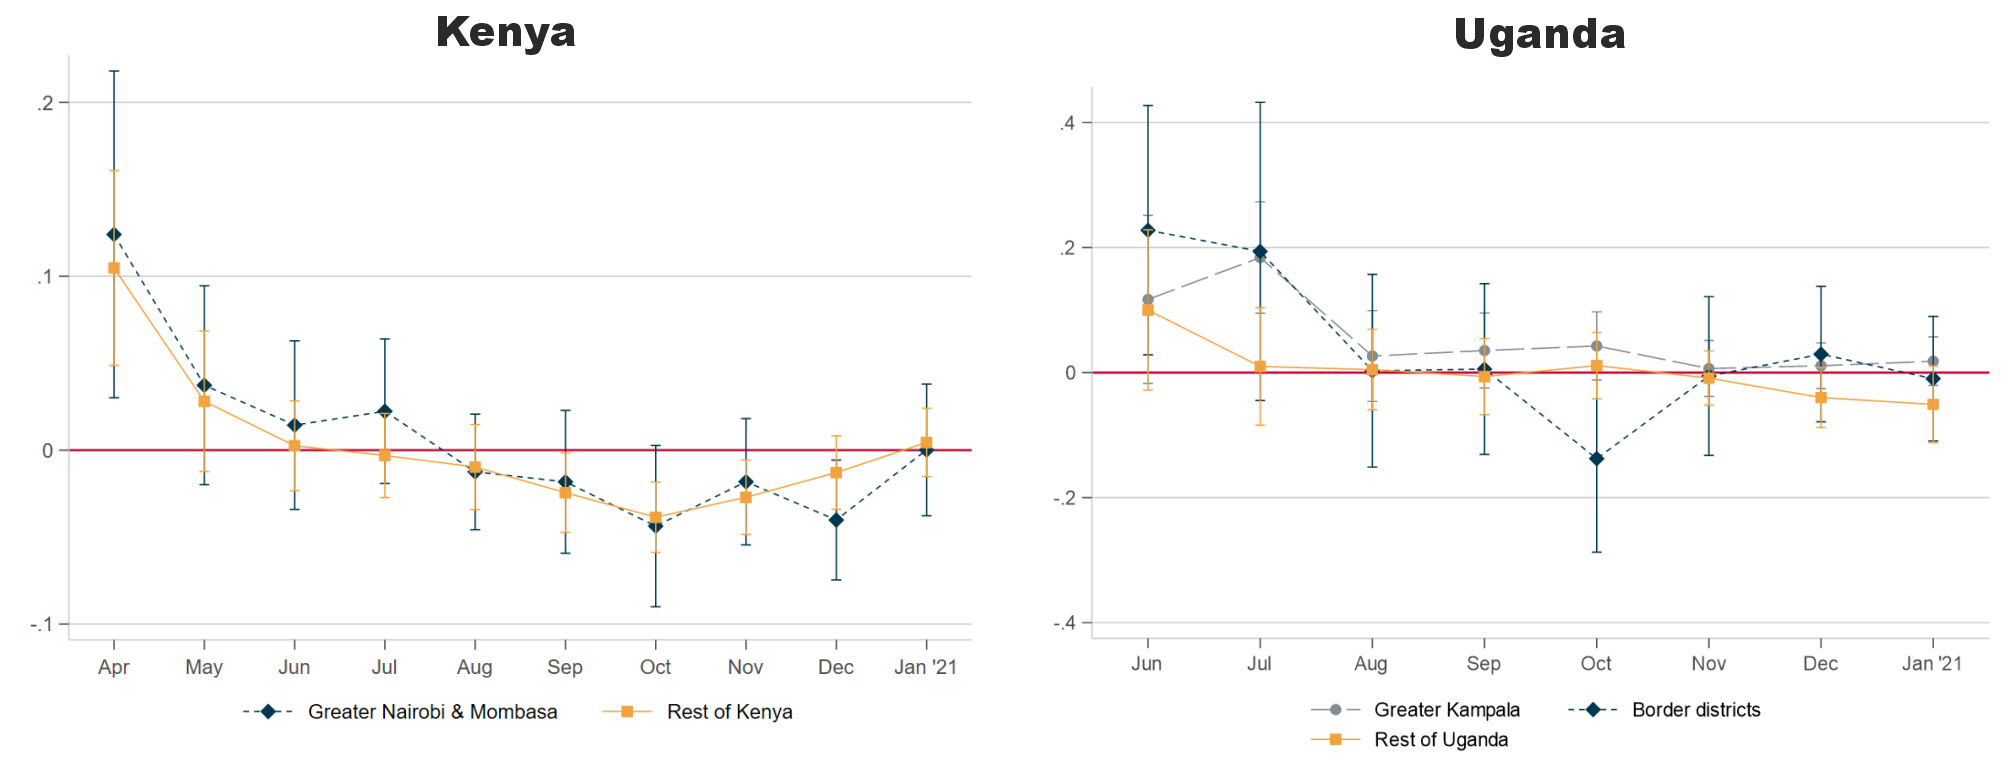
Price dynamics for different localities across time
Image description and note: Figure 1 shows the evolution of the (log) price over time controlling for item, brand, and county/district fixed effects. We distinguish between the Rest of Kenya, and Greater Nairobi and Mombasa. The latter imposed travel restrictions between 6th April and 7th July 2020. For Kenya, the data covers the time period between the last week of March 2020 until the first week of March 2021. In Uganda, we distinguish between Greater Kampala, the border districts which were under prolonged lockdowns, and the rest of Uganda. For Uganda, the data covers the time period between the last week of May 2020 until the second week of March 2021. The error bars indicate 95% confidence intervals.
Uganda
In Uganda, prices remained higher until July 2020 in the 40 border districts that had prolonged lockdown measures imposed. However, the same pattern is also observed for the Greater Kampala region, where the main lockdown measures were lifted in late May.
Price dynamics and mobility patterns
In contrast to the more short-lived impact of the lockdown measures, changes in mobility patterns continued to drive price dynamics beyond the initial lockdown phase. Interestingly, the findings suggest that retail prices increase as the level of activity at workplaces, grocery and retail stores declines. Researchers estimate that a 10-percentage point reduction in activities at workplace locations corresponds to a 0.3% and 1.4% increase in food prices in Kenya and Uganda respectively. The results are stable across a number of robustness checks, although researchers cannot rule out that the effect is indeed zero in Kenya. In Uganda, researchers find that prices for imported products follow a different pattern, where prices rise with an increase in mobility.
Timeline
July 2020 - March 2021
Location
Kenya and Uganda

Theme
Macroeconomics and Growth
Associations
Title photograph by Raphael Bradenbrink